
* With apologies to Aleph One of buffer overflow fame
Using Didact AI’s deep learning-powered equity analysis engine to automatically discover M&A candidates and beat the market
TL;DR #
-
To showcase the capabilities of our equity analysis engine, we demonstrate how to automatically identify, rank, and pick industry-scale “disruptors” from within the Russell 1000.
-
Our engine can be configured to pick companies that have different business models and/or risk exposures compared to others in their industry, as stated in their SEC filings. We term such companies as “disruptors”.
-
We show that out of our yearly pick of 50 Disruptor stocks, an average of 32% get acquired within 3 years.
-
Next, putting on our quant trading hats, we build a simple market-beating trading strategy around these names and backtest its performance. (It’s good, but don’t take our word for it.)
-
Finally, we talk about our technology, how it can be used (for good and evil), and how to get in touch with us if you want to know more.
So far so good? Great! The rest of the article is equally succinct, we assure you.
The Markets and Didact #
Predicting is hard. Predicting the future, doubly so. Predicting the markets is an exercise for masochists. Why?
For starters, investors today are flooded with information. There are SEC filings to analyze, earnings calls to listen to, central bank statements to parse, talking heads on CNBC to mute, N-95 mask sales to track, global macro spikes and extreme volatility to hedge against, and infinitives to split.
Meanwhile, most sell-side equity research is useless, with an estimated 5% of reports being read, while the rest remain moldering in your inbox.
Finally, the act of analyzing a public firm is perilous. Supply chains are increasingly global (h/t coronavirus yay), services offerings are intertwined, product cycles are shrinking, and traditional factor analysis is starting to fail, impacting the fates of the hedge fund-pension fund industrial complex.
To sum up:
- There is a deluge of information.
- Sell-side coverage volume and quality are declining simultaneously.
- There is very little alpha, if any, to be gleaned from sell-side equity research.
- Equity modeling requirements are increasingly onerous.
This is where Didact comes in.
What does Didact do? #
At Didact AI, our mission is to build the world’s best deep learning-powered equity analysis engine, in order to harness and distribute sweet, sweet alpha to all our customers.
In a world where everything from cars to your friendly eavesdropping home automation spy devices are powered by deep learning, how are we different? Glad you asked.
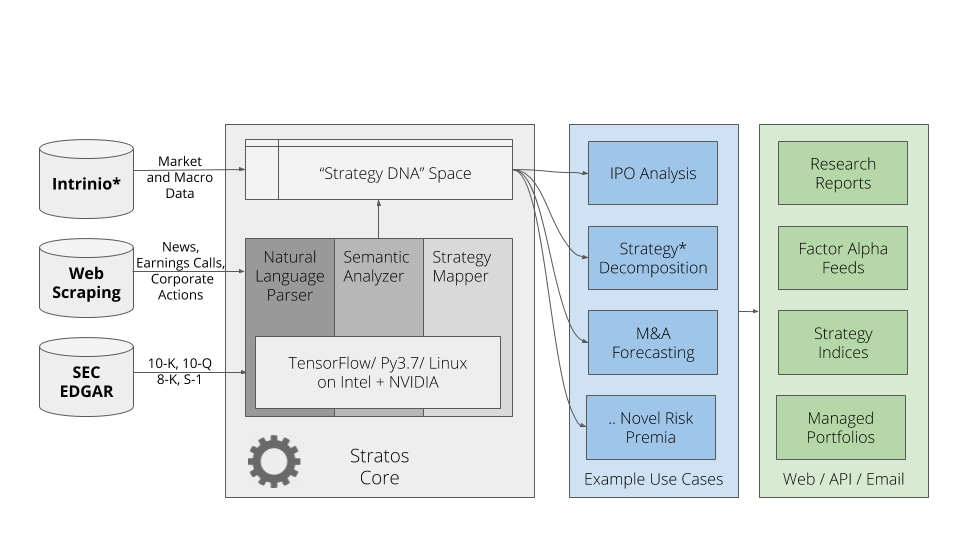
Our analysis engine (Stratos Core in the diagram above), lovingly handcrafted by the team here in NYC, consumes SEC filings, earnings call transcripts, news feeds and corporate action data to build a constantly-updated dynamic view of every listed company in the Russell 1000 (covering >90% of the US stock market’s capitalization). We call this view Strategy DNA, as it encompasses the idea that, as companies evolve through time, their evolution can be tracked by looking at changes in their business models and risk exposure (as inferred from their SEC filings and other corporate text emissions).
For instance, we can identify industry disruptors by examining and scoring the differences between their business models and that of others in their industry. Our hypothesis is that companies evolve in a variety of ways: some are still figuring out their business model (looking at you, Tesla), while others are steadily streaming away from being disruptors to becoming the status quo (coughNetflixcough). We demonstrate an example of this scoring and filtering process by building a model that forecasts targets of M&A activity over multiple timeframes.
Regardless, as we further hone our engine’s ability to identify and categorize company strategy, we expect to be able to examine changes in strategic positioning, differentiation, focus, and so on at a level of granularity that’s never been done before, for all publicly listed companies globally.
An example use case: M&A forecasting #
Here’s a brief overview of our simple M&A forecasting model:
- Every year on March 31, we obtain a list of the latest Russell 1000 constituents. Note that the index is reconstituted every year in the June-July timeframe; some stocks are dropped, and some added.
- Using Stratos Core, we get the latest Strategy DNA vectors for every company in the above list, then score each one on disruption potential. This proprietary “Disruption Score” is computed from a combination of text-based factors that unify two otherwise distinct sets of companies: (1) those that demonstrate high growth in a market segment which is complementary to market leaders, while being exposed to risk factors that are unlike those faced by the latter, and (2) erstwhile market leaders that are now facing difficult competitive environments.
- We trim the list down to the top 50 companies by “Disruption Score”; these are our M&A candidates. We track these companies over the next 5 years, starting from April 1 of that year.
To summarize: every year, on March 31, we freeze the Strategy DNA vectors, compute Disruption Scores, pick our list of candidates, and track corporate announcements for each one over the next 5 years. Luckily for us, all of this can be automated.
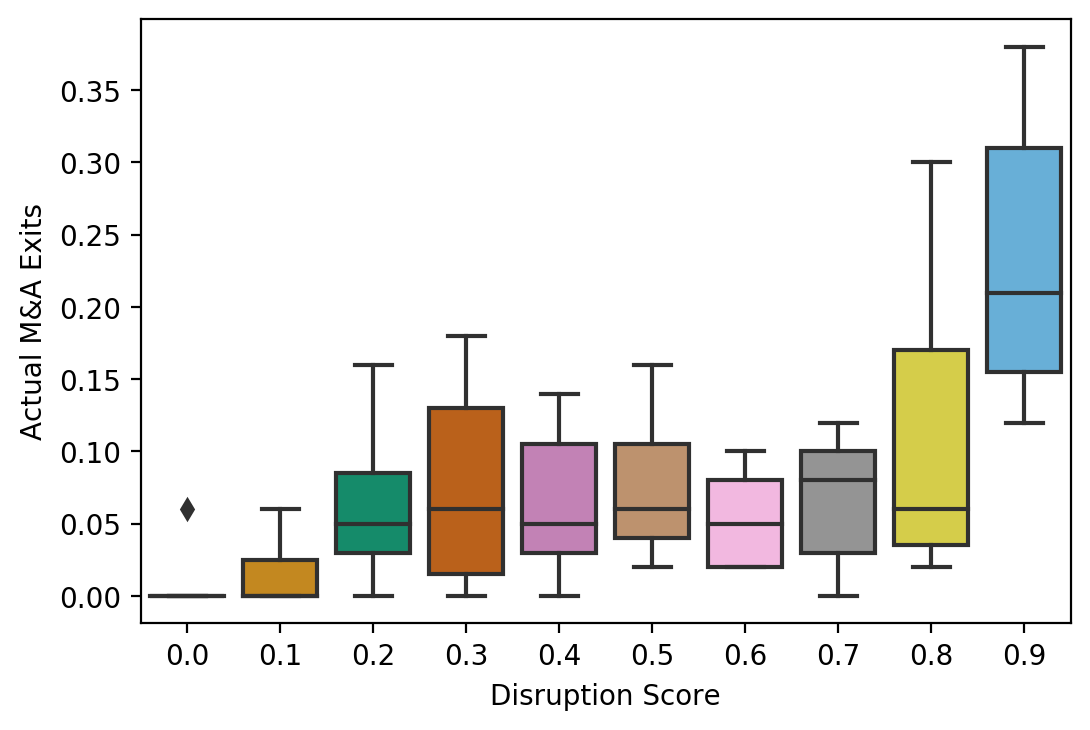
For those curious as to how effective our Disruption Score-based sorting has been in predicting M&A exits, this box plot shows how the highest scorers compare as a whole against low scorers over a 2-year time horizon (the y-axis denotes % of companies in list that had M&A-driven exits):
Here’s how it all looks in our prototype web app (sigh yes, we know it’s ugly - we are self-funded machine learning practitioners and ex-traders, not JavaScript ninjas):
This example model has a large implication: we have shown here that it is technically feasible to identify and isolate subtle patterns in capital markets, by performing rigorous machine-driven text analysis, doing the bulk of the legwork of a traditional special situations analyst specializing in merger arbitrage.
As an example, in the video above, the Disruption Scoring tab uncovers the fact that Lowe’s (NYSE: LOW) has been struggling for a while, and is ripe for an M&A play. Our system has rated it as 0.9 multiple years in a row. We would not be surprised if other players in the retail space launched an acquisition play soon.
Walk-forward forecast performance: on average, 32% of our picks have been acquired within 3 years, 23% within 2 years
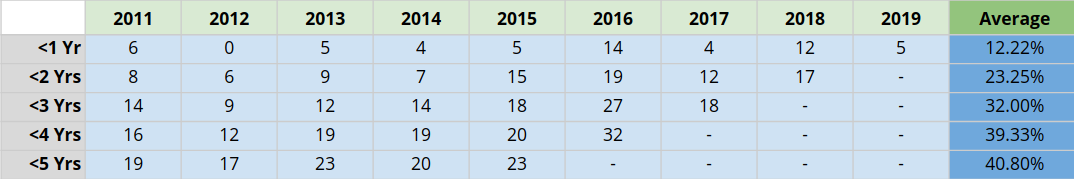
Summarized above is the year-wise performance of our picks - some points worth noting:
- There are some empty spots, because of the lack of sufficient data. This is more prevalent after (and including) 2016, since we haven’t reached the year 2021 yet.
- One can surmise the existence of an M&A cycle that roughly peaks around the 2016 time-frame.
Let’s go ahead and build a trading strategy around this model.
Building a trading strategy #
With apologies to “The Simpsons”, everyone knows the best possible trading strategy in the world is to:
- Buy 50 stocks
- ???
- Profit!!
In the interests of time, we decided upon a simpler approach, that had the singular merit of being extremely easy to code up:
- Get the top 50 M&A candidate picks for a given year (ending March 31st) from Stratos.
- Apply a 200-day Simple Moving Average filter starting April 1st (or the next trading day, if this is a holiday). Ensure appropriate lags so that you’re not buying on the same day’s close.
- Buy those stocks that are above the 200-SMA; sell if they go below the 200-SMA; buy again if they go above the 200-SMA. (Our findings indicate the number of crosses isn’t actually that many; hugging the 200-SMA is much more prevalent around equity indices.).
- Apply an equal-weighted strategy, i.e. 2% allocation for every stock; if the stock is below the 200-SMA, the 2% remains in cash, to be used if or when the stock finds itself above the line.
- If a stock is bought, hold until one of the following happens: (1) it goes below the 200-SMA, (2) it gets acquired, (3) it’s taken private, (4) it gets delisted (rare, but happens sometimes), or (5) until the next SEC 10-K (annual) filing is published.
Here are the results of our back-tested walk-forward trading strategy compared to IWB - the Russell 1000 ETF (we assumed transaction costs of 15 basis points for every buy/sell):

For all you emptors, there be caveats! #
Here are some of the obvious ones:
- Remember that M&A activity within the class of equities is modulated on larger macroeconomic cycles, going down right before and during a recession, and peaking at or near the end of a bull run. It looks like we are approaching the end of a bull market, and our strategy has not been exposed to a bear market yet.
- We have implemented a simple equal-weighted portfolio that is rebalanced annually. Other allocation strategies might be better suited to optimize for certain traits (e.g. volatility targeting to get smoother return profiles). We don’t know. We haven’t tried yet. Sad face.
- We assume a constant 15 bp transaction cost, across all tickers and across all years. This might be a mediocre assumption at best, and foolhardy at worst.
- This is simply one trading strategy; one can create many more by, for instance, the judicious use of equity options.
To sum up, we freely admit that the above strategy is weak: to be clear, it demands more trading than would be wise for an individual investor. A logical next step would be to use these M&A candidate shortlists as starting points to dig deeper and whittle down the lists based on other criteria (e.g. accounting criteria such as revenue growth). One of the (many, oh so many) items on our roadmap is to be able to automatically tease out interactions between stock aggregations and the hundreds of equity risk premia that have been discovered in the last thirty years or so.
Ok, this works - now what? #
Stock selection and trading strategy design are simply the tip of the iceberg as far as the potential of Didact’s Stratos engine goes. Imagine a tool that lets investors and traders:
- visually explore and interact with the multidimensional nature of markets as they evolve through time and across geographies,
- decompose listed companies across the world into their component business strategies and fine-grained risk exposures,
- mix other heterogeneous data streams such as patent filings and geopolitical events,
- isolate and curate unique equity risk premia based on the specific analysis at hand,
- blend companies into thematic plays that target global macroeconomic or industry-specific views, and
- publish reports and/or customized data feeds that can be incorporated into their trading systems or discretionary platforms.
We are excited for Didact and for the future of financial markets. So should you be.
Some FAQs #
Q. Is Didact a robo advisory firm?
Short answer: No.
Long answer: Not really. Robo advisory firms mechanize the low-hanging fruit of retail investment management - picking the cheapest funds, performing tax loss harvesting, rebalancing portfolios on predefined schedules, and so on. They are a great fit for people with a “hands off” approach towards investing.
Our targets, on the other hand, are active investors - driven by curiosity, interested in figuring out what makes the stock market tick minute by minute, and how to outfox it. For such people, we aim to provide wholly customized and market regime-modulated bleeding-edge insights and alpha strategies.
Q. If your strategy is so successful on paper, why aren’t you rich?
Answer: It took us the better part of a year to figure out how best to solve the problem of automated analysis of text missives from potentially all listed companies (“all the text, all the time” as one of us so eloquently put it). We intend to test and productize every potential source of alpha that emerges, based upon our slicing and dicing the strategy space we create through our engine. Maybe that’s how we will strike gold.
Q. How does machine learning or AI play a role in this?
Answer: The core of our operation lies in the unique breakthrough way we analyze text for financial markets. Traditional deep learning models, applied without forethought, fail frequently in this domain, sometimes spectacularly so (looking at you BERT, looking hard at you). We are optimistic that our proprietary and unique approach will help us build a much better system to analyze financial markets at scale.
Q. If this works so well, why don’t you raise capital for your measly little startup?
Answer: Why do you think we wrote this post?