
Back in March 2020, when I came up with my basic market regime model, a lot of folks asked me to help them track when it would be safe to get back into markets. I quickly set up a free email newsletter with a singular purpose: a daily email to inform my subscribers that, yes, market reentry is safe, or, no, it’s not yet safe.
I called it “Calm After the Storm”. The architecture was simple: one Python script (I lovingly named it Cassandra, for obvious reasons) to model the current market regime and forecast its trajectory, with follow-on analytics to estimate forward returns on S&P 500 over short-term timeframes. I hooked this up with a composer script that generated Mailchimp emails to a subscribers who had signed up via a Google Form backed by JotForm. Easy enough.
The basic question remained the same however: I have a bunch of cash that I took out of the market when the pandemic news tanked the indices. When do I reinvest it? Will your model tell me?
Readers. I nailed the timing.
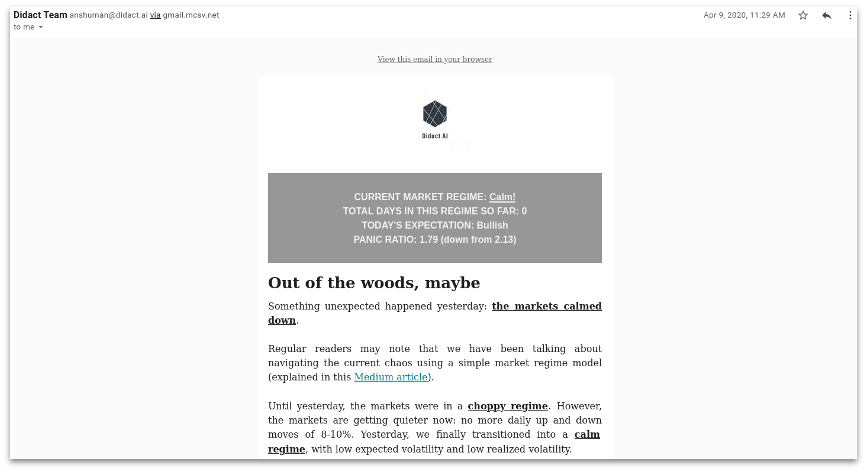
Here is the daily email I sent on April 9, 2020:
And this is how the S&P 500 evolved after that date:
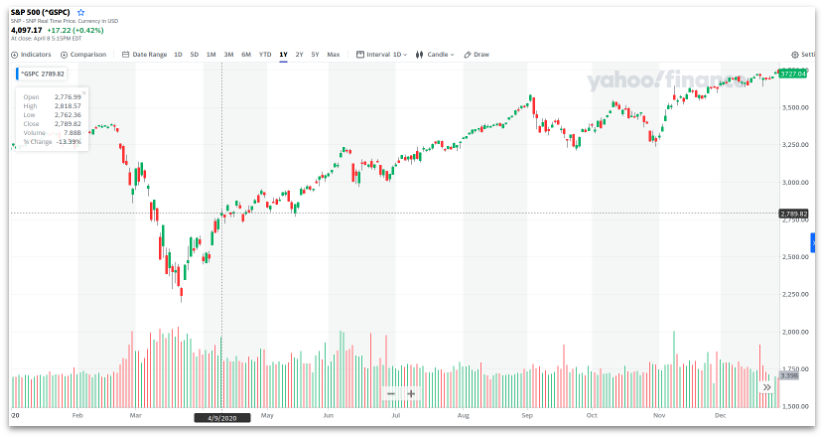
You can see that the email was sent out almost perilously close to the actual local market bottom. Other market timing systems, notably Investors Business Daily (IBD), had their follow-through day counts mark an end to the mayhem a few days later (April 11th, IIRC), which they were justifiably proud of.
But, hey, this works too!
So what’s next? Now that the markets are relatively stable, one thing folks want is to figure out which stocks to buy through the bull run.
Great question! I’ll tackle this in another post.